Miscellaneous
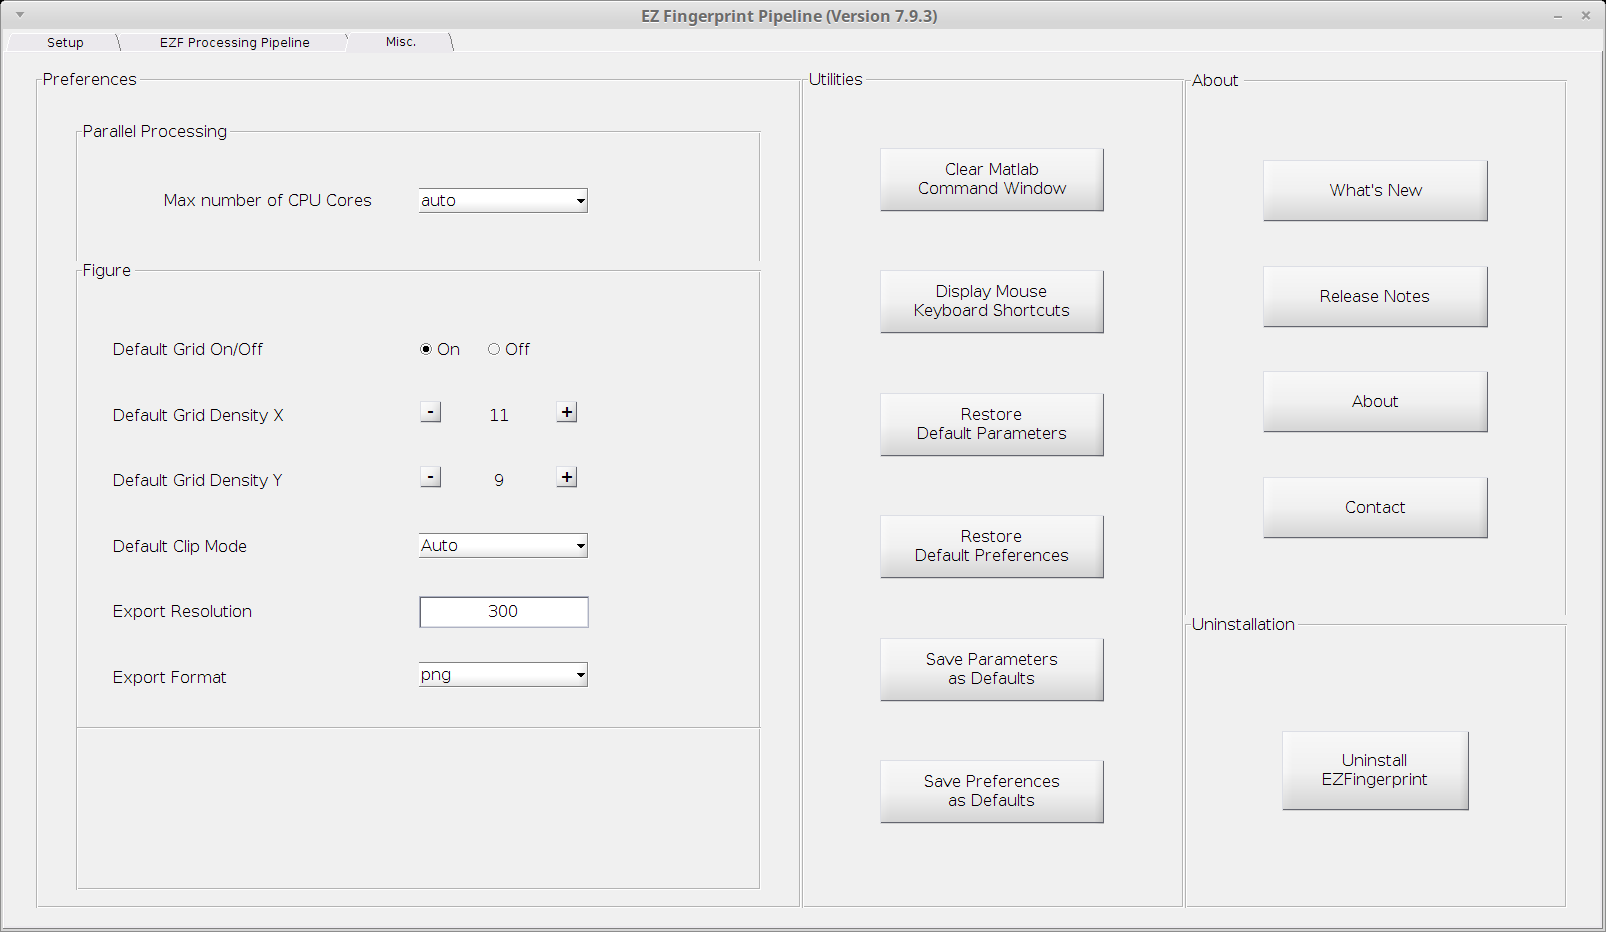
We provide a variety of preferences and utility functions to better customize your habit of using EZF.

Preferences
Max Number of CPU Cores:
If you have a multi-core CPU (very common nowadays) in your computer and have the parallel computing toolbox installed with your MATLAB, you can set the how many cores can be used for processing. Using multiple cores for parallel processing will significantly speed up the computations. If you don’t on the other hand, this option will be greyed out.
auto:
Automatically determined (the maximum number of cores - 1, save one for your OS)
0 - the maximum number of cores:
Your choice of the cap of the number of cores. 0 means do not use parallel processing.
Default Grid On/Off:
Whether show grid or not on the individual TF plot at the beginning. You can turn the grid on or off manually by pressing
gafter the TF plot has been plotted. See all visualization functions here.Default: On.
Default Grid Density X:
The default density of the grid along x-axis on the individual TF plot at the beginning. You can increase or decrease it manually by pressing
leftarroworrightarrowafter the TF plot has been plotted. See all visualization functions here.Default: 11.
Default Grid Density Y:
The default density of the grid along y-axis on the individual TF plot at the beginning. You can increase or decrease it manually by pressing
downarroworuparrowafter the TF plot has been plotted. See all visualization functions here.Default: 9.
Default Clip Mode:
The default clip mode of the TF plot at the beginning. Choose one among ‘auto’, ‘high’, ‘low’, ‘global’ and ‘off’. See all visualization functions here.
Default: auto.
Export Resolution:
The resolution when exporting a TF plot to disk in DPI. This is the only place to set this parameter, changing the resolution during exporting is not provided.
Default: 300.
Export Format:
The file format when exporting a TF plot to disk. Choose one among ‘eps’, ‘epsc’, ‘jpeg’, ‘pdf’, ‘png’, ‘ps’, ‘psc’ and ‘tiff’. This is the only place to set this parameter, changing the format during exporting is not provided.
Default: png.
Utilities
Clear Matlab Command Window:As its name suggested. Debugging and verbose info is usually printed in the MATLAB command window. This button provides a convenient way to clear it. (A even faster way is to press
ckey when EZF is on focus)Display Mouse & Keyboard Shortcuts:Check all available shortcuts here if you forget any.
The rest four button allows you restore/save default parameters/preferences.
Restore Default ParametersRestore Default PreferencesSave Parameters as DefaultsSave Preferences as Defaults
About
What's New:Check the new feature added during the lastest update.
Release Notes:Check the history of release.
About:Basic information about us and this EZF software.
Contact:Trigger your email client so you can contact us or send us your feedbacks.
Uninstallation
Click the Uninstall EZFingerprint button for a complete (nothing left-over) uninstallation of EZF.
Advanced Options
Developer Mode
If you are confident with how to manipulate the software, a little more flexibility is provided in a developer mode. In such a mode, you may be able to
Focus on other MATLAB windows while a progress window is currently shown on top. (usually you are not allowed to click anywhere else other than the progress window when a computing procedure is ongoing to avoid mis-clicking)
Force to
Reloadthe data panel from the disk if you manually update any information in the workspace.
You can turn ON the developer mode by:
Left-clickanywhere in the “Uninstallation” panel other than the uninstallation button under the “Misc” tab 5 times. AReloadbutton will appear at the end of the data panel.
You can turn OFF the developer mode by:
Left-clickanywhere in the “About” panel other than the four buttons under the “Misc” tab 5 times.
Factory Reset
You may have played with the parameters and/or preferences and saved your version as defaults. In case you want to set everything back to its initial states, you may perform a “factory reset”.
- When you are in the “Misc” tab, type literally “factoryreset” (all in lower case) on your keyboard, a confirmation prompt will show up and click
Yesto reset ALL parameters and preferences to their default values.